Semantic Layer Tools Comparison for Mid-Size Data Teams
Warehouse-native tools now make metric consistency affordable for single-platform teams.
Picture the Monday leadership meeting. Marketing pulls up a dashboard showing a healthy number of active users. Product pulls up a different dashboard showing a noticeably smaller number. Nobody in the room did anything wrong. Two people just built two different definitions of "active," months apart, and neither one knew the other existed. That's the problem this article is about: mid-size data teams, roughly those at companies between 50 and 500 people, and the decision they face about how to keep metrics consistent without buying more infrastructure than they need.
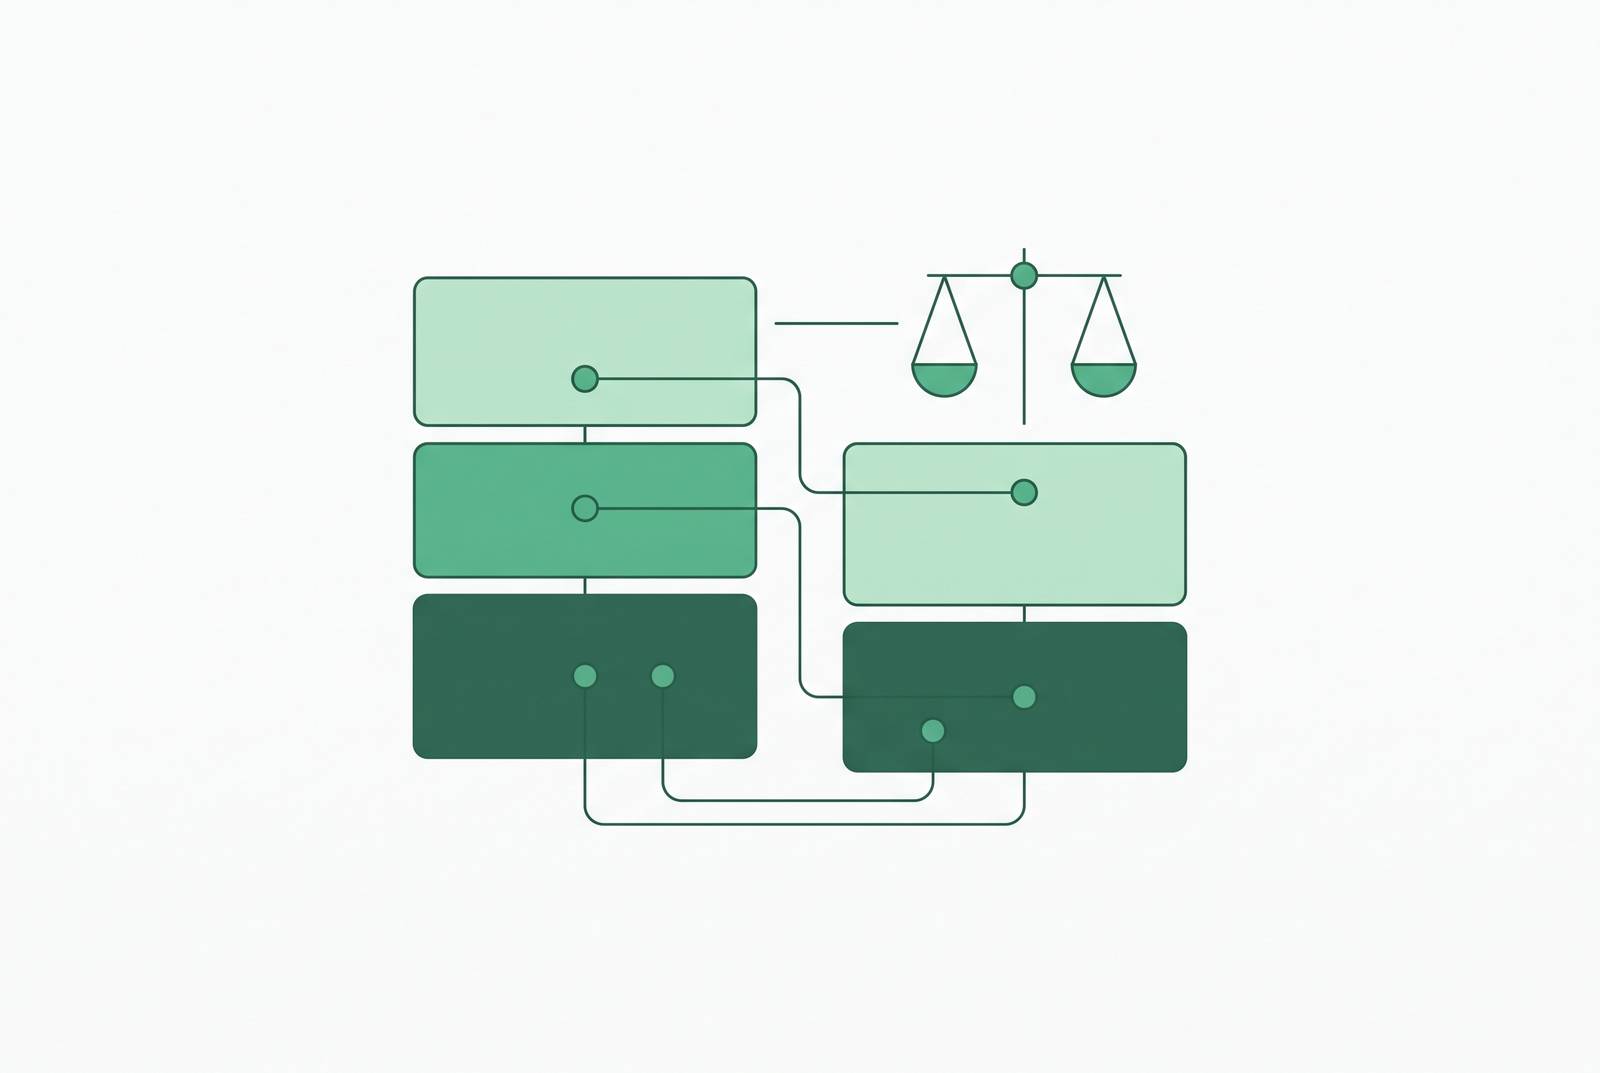
That mismatch in the meeting is a logic problem: two people wrote two different rules for what counts, and both rules live in two different places. Fix the chart and the numbers still won't match next quarter, because the underlying definitions were never reconciled in the first place.
Enterprise software has an answer for this: a full modeling platform, usually with a team of people whose whole job is maintaining it. That works when a company can afford to hire for it. For a mid-size company without a dedicated team to run it, that same platform becomes the problem it was supposed to solve. Someone has to build it, someone has to learn it, and someone has to keep babysitting it instead of answering actual business questions. The tool meant to save time ends up eating the team's time instead.
Three things make this decision harder to put off in 2026 than it was two years ago. AI agents now pull numbers straight out of the data stack with nobody checking the math in real time, so a wrong number can travel through a report before a human ever looks at it twice. Natural-language query tools have made this worse in a subtle way: a wrong answer sounds exactly as confident as a right one, because the tool doesn't know the difference either. And warehouse-native tools, covered later in this piece, have matured enough in 2026 that "free" is now a real option for teams running everything through one platform, not just a line in a sales deck. All three trends mean metric inconsistency now shows up earlier in a company's life than it used to.
What a semantic layer does
A semantic layer is a layer of governed translation between raw data (sitting in warehouses, lakes, and other storage) and every tool that reads from it. It holds one definition of each metric, dimension, and join, so the same question returns the same number no matter who's asking or which tool they're asking it from.
Four things live inside it. Metrics are the aggregations, like revenue or churn rate. Dimensions are the categories you slice by, like region or product line. Relationships describe how tables and entities connect to each other. Business rules cover the fiddly stuff, like fiscal calendars, currency conversion, and custom reporting periods that don't match the calendar year.
Place matters here. A semantic layer sits after the data has already been cleaned and transformed (by something like dbt) and before that data reaches a dashboard, a report, or an AI agent. It doesn't do the transformation work, and it doesn't draw the charts. It sits in between, making sure both sides agree on what the numbers mean.
It also helps to know what it is not. And it's not a BI tool, which turns the data into charts. Mixing these up is the easiest way to buy the wrong product, because vendors in each category often use overlapping language to describe different jobs.
A useful way to break this down, borrowed from ER/Studio's buyer's guide, splits the work into three tiers: modeling (defining entities and schemas), governance (cataloging and approving definitions), and execution (turning definitions into actual runtime queries). Vendors routinely package all three under one product name, which is a big part of why buyers get confused about what they're actually paying for.
For a mid-size team, the useful question is which tier is the actual bottleneck, not whether all three are needed. Most teams under 200 people already have reasonable modeling and don't need another catalog to prove definitions exist on paper. What they're missing is execution: a reliable way to turn an agreed-upon definition into the same query, every time, no matter who's asking.
The three architectural categories
Every semantic layer tool on the market fits into one of three architectural buckets, and switching categories later usually means rebuilding every metric definition from scratch, so this is the decision to get right the first time, not something to patch later.
The first category is the decoupled or headless layer. It lives outside any single warehouse or BI tool, so definitions survive a platform change, a new BI tool, or a second data source being added later. The cost is an extra service to run and maintain, and the real investment is the work of modeling every metric correctly, which takes time regardless of whether the tool itself is free. This fits teams running more than one warehouse or more than one BI tool, or any team that expects to switch platforms within the next couple of years.
The second category is the BI-native layer, where the semantic layer is built directly into the BI tool. Nothing extra to install, nothing extra to run. The catch is that definitions only speak that one tool's language, so an AI agent, a second BI tool, or an embedded app can't read them. This fits teams whose reporting lives almost entirely in one BI tool, used mostly by people clicking around a dashboard rather than machines querying it directly. More AI tools generate their own SQL and more people export raw data to CSV, and a rule that only exists inside the BI tool's settings doesn't travel with the data, so a hidden column or an excluded record quietly reappears somewhere else.
The third category is the warehouse-native layer, where definitions live inside the warehouse itself (Snowflake or Databricks, for instance) and get enforced right at the query engine. No separate license, no separate service. The trade is that these definitions don't leave the warehouse they were built in, so a second platform means starting over with a second set of definitions. Snowflake Semantic Views reached general availability for SQL queries in March 2026, and Databricks Metric Views reached general availability in April 2026 and got open-sourced into Apache Spark. Both milestones made "free" an actual, credible starting point for single-platform teams, not a hopeful asterisk on a roadmap slide.
No category wins outright. Each one is built for a different shape of company, which the next section works through.
How stack shape and team structure determine which category fits
The question that matters most is how many data platforms the team actually runs, and who besides the engineers needs to read the numbers.
A team with all its data sitting in one place, whether that's entirely Snowflake or entirely Databricks, has a real option in the warehouse-native category. It costs nothing extra in licensing, and as of early 2026 it's mature enough to run in production rather than just a feature preview. A team built around dbt for transformation gets a natural match in a decoupled layer that plugs into dbt directly, so metric logic and transformation logic sit in one lineage graph instead of two separate systems that have to be kept in sync by hand. A team whose reporting runs mostly through Excel or Power BI already has a semantic layer, in effect, built into the tool those reports pull from, and adding a separate execution layer on top of that mostly adds complexity without a payoff, unless AI agents or outside systems need the same numbers too. A team running more than one warehouse or more than one BI tool, or one that needs to hand the same metrics to embedded apps, AI agents, and dashboards all at once, really only has one option that avoids keeping separate definitions in every platform: a decoupled layer built to serve multiple interfaces from one source of truth.
Who's asking the questions matters just as much as where the data lives. When metric definitions are buried in transformation code, nobody outside engineering can find them, let alone fix a stale one, without filing a ticket and waiting. A company where product, sales, and marketing all need to self-serve answers without writing SQL needs a layer that shows governed metrics through something readable, not just an API that only engineers know how to call. The execution tier, the part of the stack where definitions actually turn into live queries, is usually the real bottleneck for mid-size teams, and tools like Basedash that tie metric definitions directly to SQL and enforce them the moment a query runs can close that gap without demanding a whole separate governance system bolted on top.
Not every team needs any of this yet. If one BI tool handles nearly all the reporting and only a couple of people ever build a dashboard, the built-in modeling that tool already has may be plenty. The real need appears once multiple teams, multiple tools, or multiple apps all have to agree on the same metric logic at the same time. It's worth checking whether that moment has actually arrived before shopping.
The tools worth evaluating for mid-size teams, matched to the categories above
The right tool depends entirely on which bucket fits the team, not on some abstract ranking of features. A tool that's the obvious choice for a single-platform Snowflake shop would be a poor fit for a company running three BI tools and an AI agent pipeline, and vice versa.
Basedash suits mid-size teams that want one trustworthy definition and self-serve answers for non-technical staff, without standing up an entirely separate metrics service to get there. It connects straight to the production database (Postgres, MySQL, and others) and turns that into governed, consistent views, dashboards, and saved queries that product, sales, marketing, support, and ops can all use without writing SQL or opening a ticket with engineering. Row-level permissions and role-based access get enforced at the data layer itself, not configured separately inside each BI tool, so the correct filtering rules are baked into every query by default. That means an export to CSV or a query an AI tool writes on its own can't accidentally sidestep the access rules the way they might with a BI-native layer. It fits teams that need broad, governed access across a lot of different roles, prefer flat-rate pricing over paying per seat, and don't need to hand metric definitions off to outside embedded apps or a patchwork of different AI agent systems. Pricing starts with a Startup plan at $1,000 a month, covering up to 25 users and more than 750 data sources, with a 14-day free trial and no credit card required to start. Enterprise pricing is custom.
Cube fits teams that need one set of governed metrics reaching multiple destinations at once: BI tools, AI agents, and embedded apps, all from a single definition. Cube describes itself as an agentic analytics platform, and its open-source core (Cube Core, under Apache 2.0) is the semantic layer itself rather than a feature bolted onto something else. Metrics get served out over SQL through a Postgres-compatible interface, REST, GraphQL, and an MCP server, so the same definition can power a dashboard and an AI agent without maintaining two copies of the logic. Brex evaluated Cube against the dbt Semantic Layer and against LookML before choosing Cube, then built an embedded AI financial analyst on top of it, a case Cube has published as its own example. The cost here isn't a license fee so much as the up-front modeling work: metrics, joins, and access rules all need to be defined clearly before an agent has anything solid to reason against, and getting the business to agree on those definitions is usually the slowest part of the whole project.
The dbt Semantic Layer, built on MetricFlow, makes the most sense for teams already running their transformation work through dbt Cloud. Metrics get defined once, in YAML, sitting right alongside the dbt models that feed them, and MetricFlow turns those definitions into SQL automatically for any tool connected through the dbt Semantic Layer APIs. Those APIs require a paid dbt Cloud subscription to use. MetricFlow's core engine became Apache 2.0 in October 2025, so it can now run on its own without dbt Cloud, but the hosted Semantic Layer APIs, including JDBC and GraphQL access, caching, and BI integrations, still sit behind a paid plan. The remote MCP server only blocks the text_to_sql tool once an account runs out of Copilot actions, while every other remote MCP tool keeps working as normal. There's no separate caching engine built in here either; query execution gets pushed to the warehouse, though dbt Cloud does offer optional result caching and a declarative cache stored in the client's own data platform.
Snowflake Semantic Views fit teams fully standardized on Snowflake who want to avoid paying for anything extra. The feature reached general availability for SQL queries in March 2026, which made it the first real free option for teams fully committed to that platform. Dynamic Data Masking and row access policies already set on the underlying tables carry through to the semantic views automatically, so governance inherited from the warehouse doesn't need to be rebuilt separately on top. The boundary is firm, though: these definitions don't leave Snowflake. Adding a second warehouse, a second BI tool querying outside Snowflake, or an AI agent that needs context spanning more than one platform means a separate set of definitions has to be built and kept in sync by hand.
Databricks Metric Views work the same way for teams standardized on Databricks and the lakehouse pattern, with metric governance built straight into Unity Catalog and no separate service required. The same platform boundary applies here as with Snowflake: these definitions stay inside Databricks, and any multi-warehouse setup needs its own separate approach layered on top.
No tool on this list is the universal right answer. The honest version of this decision starts with the stack a team already has, and the tool follows from that, not the other way around.