Exposing Semantic Layer Metrics to Non-SQL BI Tools
Semantic layers let BI tools share one definition of every metric.

Ask five people at a company to pull up "revenue" and five different numbers can come back. Because the logic behind that number lives in five different places: a dashboard filter here, a SQL query there, a spreadsheet formula someone built a long time ago and nobody's touched since. One dashboard excludes canceled orders. Another includes them but nets out refunds. One report calculates churn off account status, another off whether the customer actually used the product last month. Every time that logic gets copied into a new tool, it drifts a little.
The tables underneath are usually fine. What's broken is agreement: the company ends up arguing about whose revenue number is correct instead of using any of them to make a decision. A product manager waiting on a Monday morning number doesn't care that the warehouse is healthy. They care that Finance says one thing and the ops team says another, and the meeting burns twenty minutes sorting out why before anyone gets to the actual question.
AI didn't cause this. It just turned up the speed. Each guess can diverge slightly from the last. A team of human analysts might absorb some of that friction. An AI agent querying a warehouse directly can produce calculation errors faster than any team can catch them. That's the forcing function. A mess that organizations used to manage with Slack messages and tribal knowledge now has to get solved at the architecture level, because the volume of guessing has gone up by orders of magnitude.
What a semantic layer does
A semantic layer is the fix for exactly that guessing problem. It's a governed layer that sits between the data warehouse and everyone who wants to ask it questions. Metrics, dimensions, join paths, and access rules get defined once, in one place, and every tool downstream reads from that same definition instead of reinventing it.
measures:
net_revenue:
sql: amount - refunded_amount
type: sum
That's it. One line of logic. Every dashboard, every spreadsheet, every AI agent that asks for net_revenue gets amount minus refunded_amount, every time, with no room for someone quietly excluding refunds in one report and forgetting to in another.
It helps to be clear about what this thing is: a layer that sits on top of the database rather than replacing it, and it is not a BI tool either. A BI tool is just one of the many things that consumes the semantic layer's definitions, alongside embedded apps, spreadsheets, and AI agents.
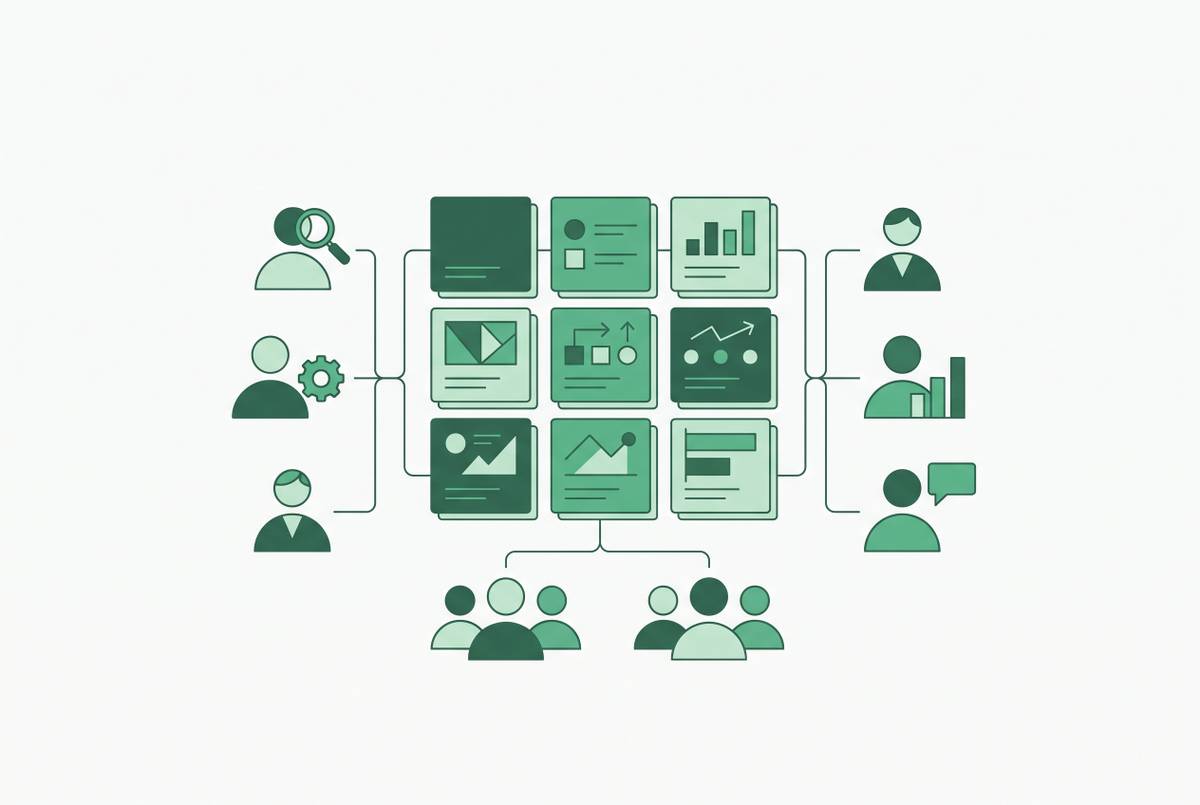
The useful way to picture it: raw technical tables on one side, every tool a human or an AI might use to ask questions on the other, and the semantic layer sitting in the middle as the shared translator both sides agree on.
A semantic layer does five jobs at once. It models the data, mapping tables and relationships into business terms. It compiles queries, so when a tool asks for "revenue by region for the last four quarters," the layer turns that into correct SQL using the join paths and metric logic already on file, rather than whatever the tool happens to guess. It handles access control, centralizing row- and column-level permissions so sensitive data stays restricted no matter which tool is asking. It caches and pre-aggregates data to keep things fast. And it exposes that same governed model through APIs built for different kinds of consumers: SQL for analysts, REST and GraphQL for apps, an MCP server for AI agents, DAX or MDX for spreadsheet-style tools.
Centralizing logic this way fixes the drift described in the opening section. Defining a metric once doesn't automatically put it in front of the product manager who just wants an answer without writing SQL. Getting that governed definition into the hands of someone who doesn't write code is a separate, practical problem, and it's the one the rest of this piece is about. AI-native BI platforms like Basedash tackle this directly by grounding natural language queries in a semantic layer with certified metric definitions, so a plain-English question and a SQL query against the same data return the same answer.
The three-layer confusion that trips up most evaluations
Shopping for a semantic layer gets confusing fast, partly because vendors use the term loosely. There are at least three distinct layers in play here, and most sales pitches blur them into one product name. That blurring costs real money when a team buys one thing expecting it to do another's job.
A semantic layer defines what a metric means. It tells a BI tool that "monthly active users" is computed a specific way in SQL or YAML, and it serves that definition to dashboards and embedded analytics. What it doesn't do is govern who's allowed to use that definition, trace where the number came from, or hand it to an AI agent with a record of how it was used.
That's the job of a context layer. A context layer governs how AI agents and analysts actually use metric definitions once they're in production, binding them to lineage, ownership, business glossary terms, and access policies, and exposing all of that governed context to agents connecting through MCP. It sits on top of the semantic layer. It doesn't replace it.
Then there's the metadata layer, usually called a data catalog. A catalog indexes what data exists, where it lives, and who's responsible for it. It doesn't define what a metric computes, and it doesn't govern how agents use that metric once they have it.
These three layers do different jobs and none of them substitutes for another. Getting the vocabulary straight before evaluating tools saves a lot of wasted budget later.
How the semantic layer reaches non-technical consumers
Defining a metric once solves half the problem. Reaching that person means getting the governed definition to someone dragging fields around in a dashboard builder, or typing a question in natural language, without either of them touching SQL. That's a translation problem, and there are three main ways to solve it.
The first pattern is BI-native embedding. Governance lives inside the BI tool itself, so non-technical users never have to leave the dashboard interface to get a certified number. Most of what makes a BI tool useful stays intact under this pattern. A second BI tool, a notebook, or an AI agent joining the stack exposes the catch: definitions built for one platform don't automatically travel, and they fork. BI-native embedding works best when an organization has genuinely committed to one platform and has no near-term plans to add another.
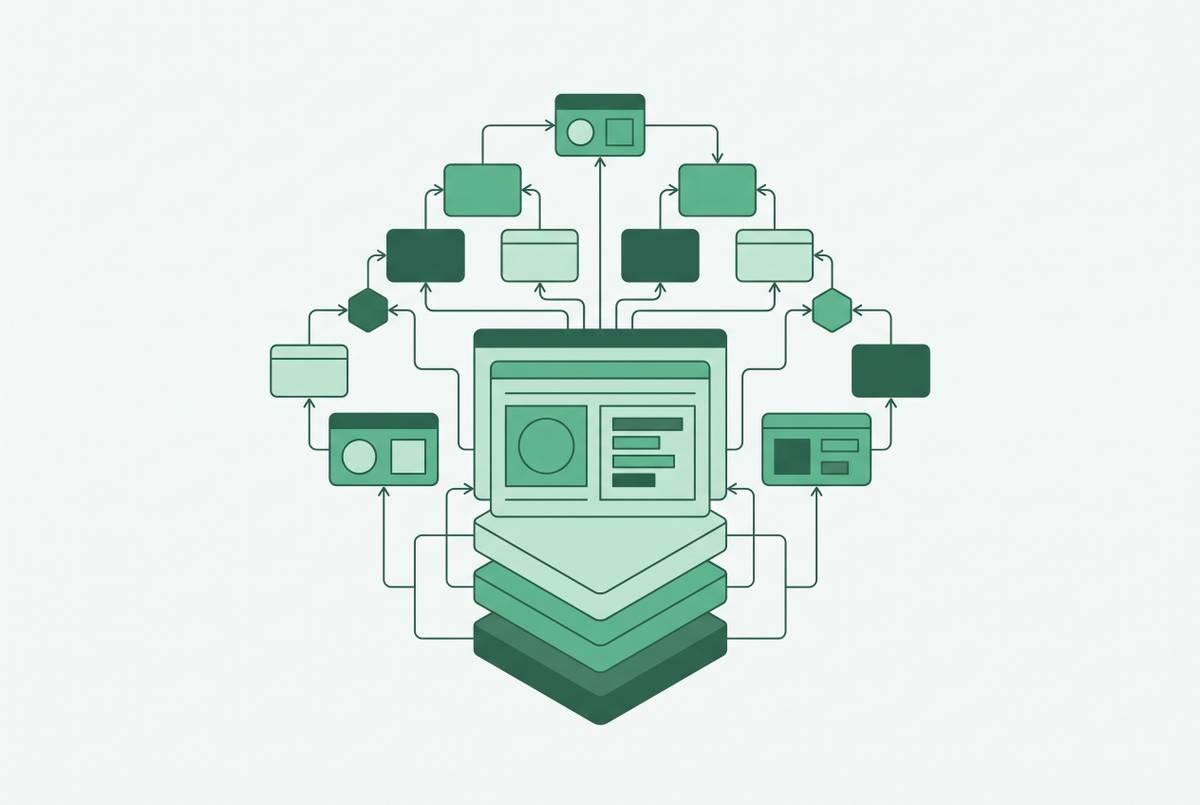
The second pattern is the headless or universal semantic layer, which sits in front of multiple BI tools and exposes metrics over SQL, REST, GraphQL, or MCP, without caring which tool is asking. The same governed model gets exposed across many interfaces at once, so each tool connects the way it already expects to connect. All three are reading the exact same metric definitions, just through different doors. This pattern earns its complexity when more than one major BI tool is actually in use, or when metrics need to reach applications, partner-facing portals, or AI agents, not just internal dashboards. That's also the layer Basedash sits in: the same governed model gets exposed over multiple APIs, so dashboards, embedded apps, and AI agents all end up reading the same certified metrics instead of each tool keeping its own copy of the logic.
The third pattern is the warehouse-native layer, where the definitions live inside the data platform itself and get queried directly by warehouse-native tools and AI interfaces. Databricks is the clearest recent example: its Unity Catalog Business Semantics reached general availability in early April 2026, alongside an open-source release of its core Metric View engine through Apache Spark. For anyone who might need to move later, it means the metric logic is tied to that one vendor.
MCP as the dominant path for AI-agent consumption of governed metrics
The Model Context Protocol, or MCP, has become the standard way to connect governed metrics to AI tools, letting those tools work with certified definitions instead of writing their own SQL from scratch.
Without it, an AI agent pointed at raw tables is back to guessing, reinventing metric logic on every single prompt and compounding drift at a pace no human team could keep up with. That's the same problem from the opening section, just running faster. With a semantic layer sitting behind an MCP connection, the agent instead picks from a set of certified metric definitions. The resulting answer can be traced back to exactly which definition it used, with a record of that choice available for review.
That distinction matters more than it sounds. The other is closer to a second, AI-shaped front door into the same governed system that humans already use.
The direction of travel here is fairly blunt: more and more of the actual querying work is shifting from human analysts typing SQL to AI systems acting on their own. Organizations that wait tend to end up locked into whichever vendor's AI ecosystem got there first, on that vendor's terms.
Open Semantic Interchange and the portability question
Every argument for a headless, tool-agnostic semantic layer eventually runs into the same objection: what happens when the metrics are encoded in one vendor's format and the organization wants to move?
OSI is an interchange format. It's not a query engine, not a semantic layer product on its own, and not a source of metric definitions in itself. A team that treats OSI as a substitute for an actual semantic layer will still need to build the layer; OSI just makes the definitions inside it easier to carry elsewhere later.
Databricks' decision to open-source its Metric View engine through Apache Spark runs alongside this, though it's a separate move: a platform vendor reducing lock-in worries by opening its own engine, rather than by adopting a shared interchange standard.
Even with a format like OSI in place, there's a limit to what portability tooling can fix. It can't make Finance and Sales agree on what "customer" means in the first place, before any portability tooling comes into play. That argument, whether a customer is anyone with an account or only someone who's paid in the last ninety days, has to get settled by actual humans before any format, standard, or semantic layer is worth building around it.
The semantic ceiling problem: not all semantic layers expose the same range of questions
Not every semantic layer can answer the same range of questions on its own, and that range, call it the semantic ceiling, ends up being the real limit on what self-service analytics or AI analytics can do once the layer is in place.
Simple lookups work fine almost everywhere. The harder requests are the ones that actually fill up an analyst's queue: cohort analysis, period-over-period comparisons, ratios that cross different levels of granularity, calculations nested inside other calculations. Those are the questions that separate a layer that looks good in a demo from one that holds up under real use.
There's a direct way to test this before committing to anything. Take the single hardest real question the business actually asks, something combining a cohort, a period comparison, and a cross-grain ratio, and run it through the tool as one query. Whatever it can't handle natively becomes the thing a data team ends up paying for in workarounds over the following years.
Evaluating the demo instead of the architecture behind it is the mistake that costs the most here. A clean, simple question with an obvious answer makes almost any tool look capable. A polished demo environment isn't a fair test; the real test is the hardest question the business actually asks, the one nobody prepared for.
Tools that connect a semantic layer to non-technical users
Basedash approaches this as an AI-native BI platform built around a semantic layer from the start, rather than one bolted on after the fact. Metrics get defined as Models, which combine reusable SQL with declared measures, segments, and dimensions, and Basedash is set up so AI can create and update those definitions, not just read them back. A non-technical user asking a plain-English question gets an answer grounded in the same certified metric a SQL analyst would write by hand, and the two should never disagree. Pricing runs flat-rate rather than per seat, starting at $1,000 a month plus AI usage for up to 25 users, with a 14-day free trial, which changes the math for teams that want every non-technical person in the building querying governed metrics without a per-seat bill scaling against that.
Teams already committed to a single BI platform have a reasonable option in native embedding, where the semantic layer lives inside the BI tool itself. Power BI's approach, with its DAX semantic model reachable through XMLA endpoints, fits organizations that have settled on one tool and don't expect to add a second major BI platform anytime soon. The tradeoff occurs the day a notebook, a second dashboard tool, or an AI agent needs the same numbers: definitions built for one platform don't travel cleanly, and the fork begins.
Teams running multiple BI tools, or planning to put AI agents directly in front of governed metrics, tend to need the headless pattern, where one layer sits behind everything and speaks SQL, REST, GraphQL, and MCP all at once. Its ranked accuracy on AI analyst benchmarks reflects how faithful a natural-language answer stays to the certified metric definition behind it, which is the hardest part of this to get right in practice.
None of these three paths is a universal right answer. The honest version of this decision starts with an inventory: how many tools need the same metrics, whether AI agents are already in the stack or coming soon, and how much the organization is willing to bet on staying with a single vendor for the long haul. Answer those three questions honestly, and the right pattern tends to be obvious well before any vendor demo starts.