Reproducing a Metric Value After a Schema Migration
A schema migration can break metrics silently, producing wrong numbers that look plausible.
A wrong metric after a schema migration doesn't announce itself. No red banner, no failed job, no alert. Just a number on a dashboard that looks fine, sits in a plausible range, and is quietly incorrect. That's the actual subject here: how a metric value gets broken during a migration, and the concrete work of putting the right number back on the screen.
That silence is the whole problem. An error is easy. Someone sees it, files a ticket, fixes it by Tuesday. A wrong-but-plausible number can sit on an executive dashboard for a month before anyone asks why revenue looks flat when the sales team swears it isn't.
Four distinct failure modes that produce a wrong metric value after migration
Not every schema change breaks a metric the same way. Not every schema change breaks a metric the same way. Four patterns appear repeatedly, and telling them apart is the first step toward fixing any of them.
Semantic drift. The new platform maps an old metric name onto a field that's calculated differently. A p99 latency number can shift for no reason other than the new system computing percentiles over a different time window, or quietly dropping certain HTTP status codes from the count. Nothing is broken. It's just a different definition wearing the same label. Metric renaming makes this worse: when a collection path changes, the metric often gets a new name too, so old dashboards and alerts don't throw an error but instead return wrong numbers or flatline at zero.
Column rename or type mismatch. Say a schema moves from pre-aggregated values to raw histogram buckets, so a query that used to read a single number now has to run a percentile function over bucket_bounds and bucket_counts. Or a field like response_status used to be read directly and now sits behind a label lookup. A query built for the old pattern doesn't crash. It returns zero, or something close enough to a real answer that nobody double-checks it.
Time-partitioned schema coexistence. Some migrations don't move old data forward; instead, they leave it on the old layout. Instead, a new schema block gets appended starting from a future date, and old data stays on the old layout. That's a deliberate design decision, and a reasonable one. But run a query across a date range that straddles that boundary, and it's computing across two different column layouts in the same pass. The total changes depending on which window you pick, and the query itself gives no sign anything unusual happened.
Deployment sequencing failures. Tooling alone doesn't save a team if the deploy order is wrong. Picture new application code shipped against an old database schema: the migration job fails, but the deployment pipeline pushes the new code out anyway. The next seven merges to main hit that same failed migration step, and every one of them still deploys. The live app is now selecting a column the database doesn't have. Every dashboard render throws. This isn't a subtle drift problem, it's a sequencing problem, but it lands in the same place: a metric that's wrong or missing, with no clean signal pointing at the cause.
Tracing metric lineage: mapping the chain from raw data to displayed number
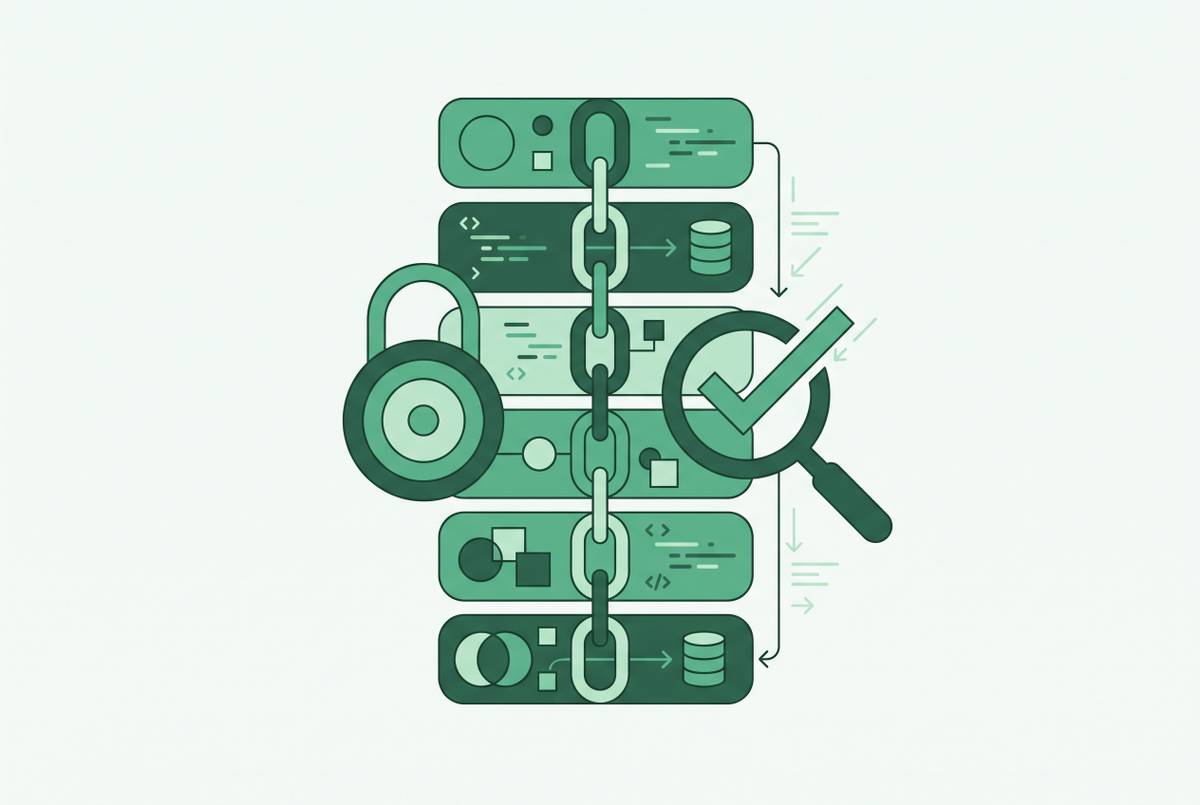
Before fixing anything, find out what actually feeds the number. Lineage, in practical terms, runs from a raw table, through some transformation logic (SQL, a dbt model, an ORM query, a stored procedure), through an aggregation step, and finally to whatever renders the final dashboard or report. The break can happen at any link in that chain, and the fix depends entirely on which one.
Start with the metric's own definition. What columns does the calculation touch? What filters, joins, aggregation functions, and time windows does it apply?
Then write down the "before" state, in detail:
- Pull the exact query or model definition from version control, from the commit right before the migration ran.
- Note the column names, the data types, and any type coercion the old query was quietly relying on.
- Record the time window and any partition or filter logic baked into that query.
Last, map every place downstream that reads the affected table or column: dashboards, saved queries, transformation jobs, any API that queries the table directly. A single column rename in a source table can break each of these on its own timeline. "The dashboard looks fine" doesn't mean the underlying pipeline is fine too.
Reconstituting the original calculation against the new schema
Once the lineage is mapped, rebuilding the calculation is a four-step job.
Step 1: Isolate the schema delta. Diff the old schema against the new one, column names, types, constraints, partition structure, all of it. For every column that changed, write down the old way of reading it next to the new way: a direct column reference that now needs an indirect lookup, a scalar percentile column that now needs a histogram aggregation function. This diff is the map for everything that follows.
Step 2: Rewrite the query against the new schema. Substitute the renamed or restructured columns while keeping the logic the same. Check type handling by hand. Something coercing quietly and correctly under the old schema might fail loudly, or worse, succeed silently with the wrong result, under the new one. If the aggregation logic itself changed (a different percentile window, say), decide explicitly: match the new platform's method, or compensate for it in the query.
Step 3: Handle the time-partition boundary. For a metric that needs to be reproduced across a period that spans old and new schema layouts, don't write one query that tries to span the boundary. Split it: one query on the old layout for the earlier range, one query on the new layout for the later range, then combine the two results at the application layer. Letting a single query engine handle both layouts in one pass is how inconsistent results sneak in. Before combining anything, confirm the math lines up the same way on both sides of the boundary.
Step 4: Separate semantic drift from structural change. If the new schema calculates the metric differently by design, rewriting the query won't "fix" it, because there's nothing broken. The real question is which definition should be reported: the old one or the new one. That's not an engineering call. It belongs to whoever owns the metric, and the decision needs to be written down somewhere other people can find it.
Validation methods that confirm the reproduced value is correct
A reproduced number isn't trustworthy just because it runs without an error. It has to be checked against something.
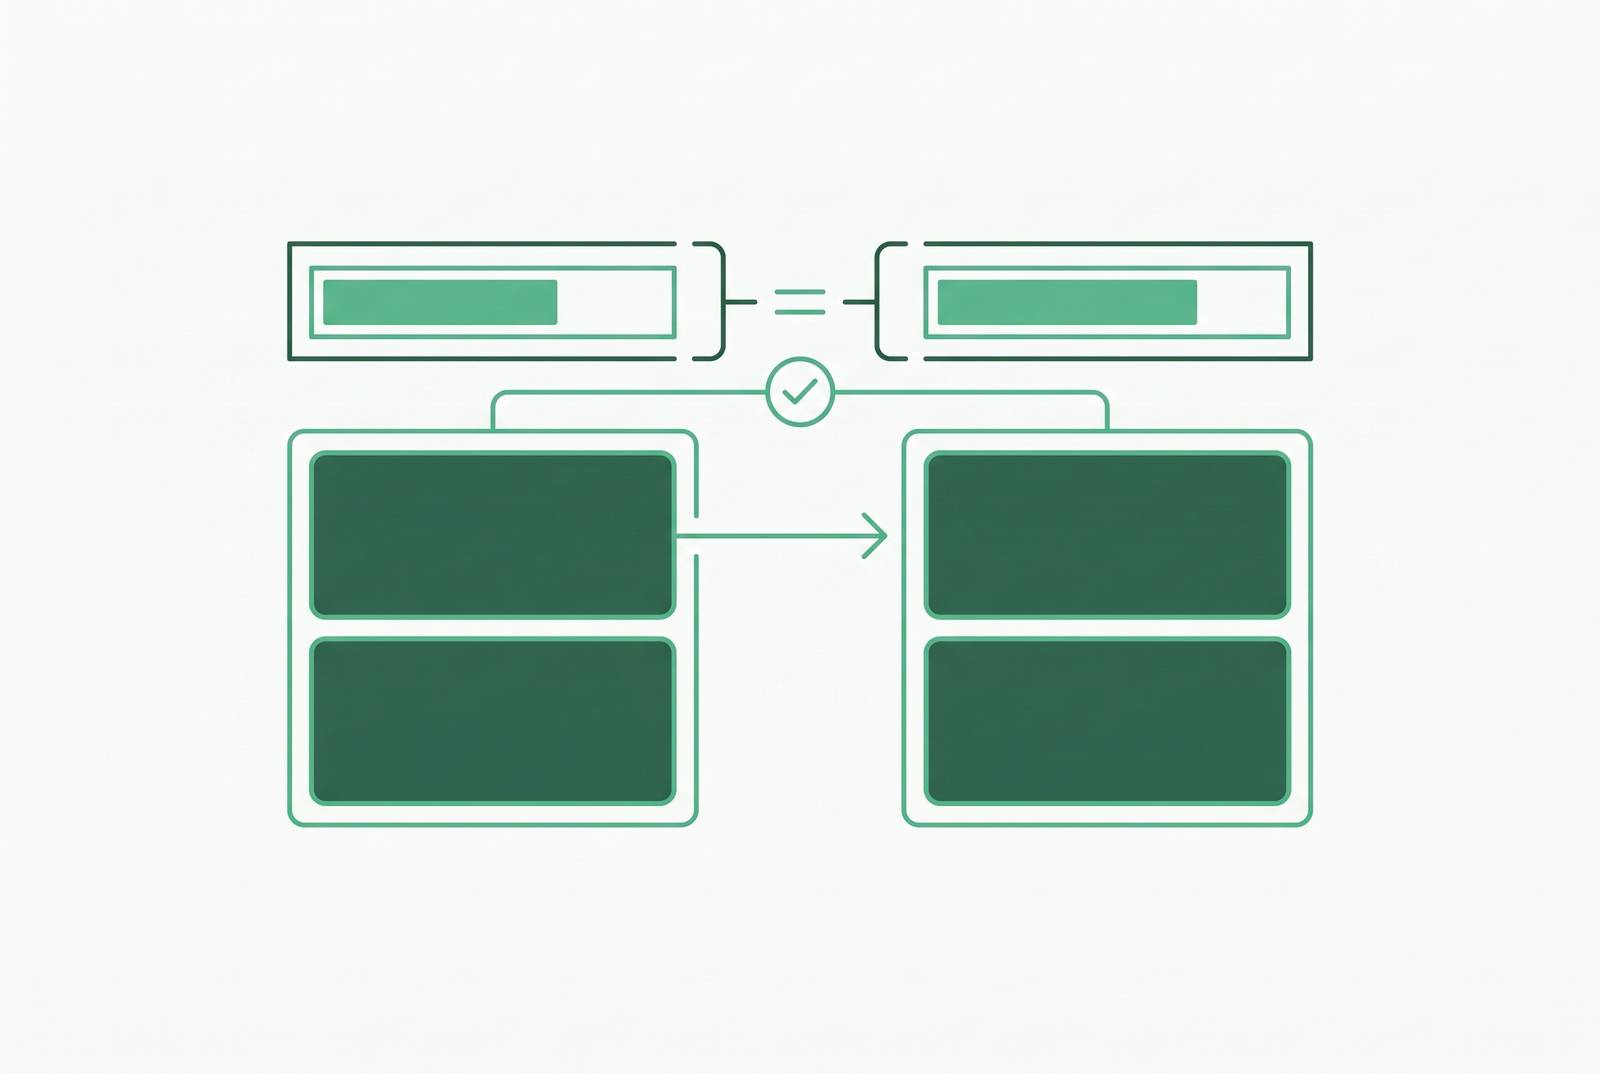
The core method is comparison against a known-good reference: a value computed before the migration, a parallel run against the old system, or a checksum against the underlying data.
Row counts and checksums. Compare row counts between the source and target tables that feed the metric. A checksum catches quiet data loss or truncation, the kind that produces a number that looks completely reasonable and is still wrong. Side-by-side parallel runs: run the old query against a snapshot of the pre-migration data, and the new query against the post-migration data, for the same time window. If the two numbers don't match, that gap is the start of the investigation, not proof that one of them is correct. Design differences surface in parallel testing. This is often where semantic drift gets caught: the same service shows a different error rate on the old platform and the new one, and running both side by side before cutover is what makes that visible. That's the value of testing both systems at once instead of trusting the new one and moving on.
Effect of migration tooling choices on metric reproducibility
Without some discipline around schema changes, environments drift apart quietly, and nobody can say with confidence which schema a given metric was actually computed against. That's the exact condition that makes reproduction so hard: different migration tools take different approaches to preventing it.
Flyway runs SQL or Java migrations through a set of commands that includes Validate and Repair. Validate checks that the deployed schema actually matches the migration history, a basic requirement for knowing which schema version a metric was calculated against.
dbmate writes out a db/schema.sql file to the repo after every migration. That means the current schema state is always sitting in version control, reviewable at any commit, which is exactly the artifact needed to answer "what columns existed on this date" when tracing a metric back through time.
Bytebase checks DDL changes against a large set of rules (over 200), flagging backward-incompatible drops before they ship, and routes schema changes through a structured review process with migration files tracked in version control. The audit trail that comes out of that process is what lets a team answer, months later, exactly when a column changed and what it looked like before.
None of these tools reproduce a metric for anyone. What they do is leave behind the paper trail that makes reproduction possible instead of a guessing game.
The semantic layer as a structural fix that makes metric reproduction tractable by default
Without a semantic layer, metric logic lives scattered across dashboards and BI formulas. When the schema changes, every one of those embedded definitions has to be found and updated by hand. That's how a company ends up with three different formulas for something like net revenue retention, each one technically defensible, none of them agreeing with the others.
A semantic layer sits between the warehouse and everything downstream, BI tools, embedded analytics, APIs, and centralizes the metric definitions in one place. A schema change means updating one definition, not hunting through every dashboard in the company to find every place that formula got copy-pasted.
The dbt Semantic Layer, built on MetricFlow, works this way: metrics, dimensions, and semantic models get defined in YAML, and MetricFlow generates SQL across warehouses like Snowflake, BigQuery, Databricks, Postgres (dbt v1 only), and Redshift. As of October 2025, MetricFlow was relicensed to Apache 2.0. It can run standalone, without requiring dbt Cloud.
Version control matters most for reproduction. When metric definitions live in Git, the "before" state of any metric is always sitting there, recoverable, diffable, exactly the artifact that lineage tracing needs.
How a database GUI with direct query access speeds up metric reproduction for the whole team
Everything described so far, comparing schema states, running validation queries, checking system catalogs, doing row-count reconciliation, happens at the SQL layer. Not inside a BI dashboard's abstraction on top of the data. Directly against the database.
That creates a real barrier for people on product, ops, or support who want to help verify whether a number looks right after a migration but don't write SQL. A database GUI that surfaces saved queries, editable data views, and dashboards directly against the production database lets those people check things themselves instead of filing a ticket and waiting.
Access still has to be handled carefully. During a migration incident, the tempting move is to just hand out database credentials to everyone who might need to look at something. That's how permissions problems start. Row-level permissions inside a proper GUI solve this: the right people get access to the right data without broad credentials floating around during exactly the moment things are already unstable.
A tool that connects directly to Postgres, MySQL, or a similar database, rather than sitting on top of a separate BI data layer, also has a structural advantage here: there's no intermediate model that can drift out of sync with the database and quietly serve a stale number. Schema changes appear immediately in the tool, because there's nothing standing between the tool and the actual table.
A repeatable checklist for metric reproduction after any future schema migration
Every migration is different, but the reproduction process doesn't have to be reinvented each time. A working checklist:
- Pull the "before" state. Get the exact metric query or model from version control, from right before the migration.
- Diff the schema. List every column, type, and structural change between old and new.
- Classify the failure mode. Is this semantic drift, a rename or type mismatch, a time-partition boundary issue, or a deployment sequencing problem? Each one needs a different fix.
- Map the lineage. Trace the path from raw table through transformation logic to the dashboard, and find every downstream consumer that touches the changed table or column.
- Rewrite the query against the new schema, preserving the original logic and checking type handling explicitly.
- Split time-partition boundaries into separate queries per schema epoch, and combine the results outside the database.
- Decide on semantic drift explicitly. If the new platform calculates something differently by design, get the metric owner to say which definition should be reported, and write that decision down.
- Validate with a known-good reference: row counts, checksums, or a parallel run against the old system.
- Document the schema epoch the metric now depends on, so the next migration doesn't start this whole process from zero.
None of this stops schema migrations from happening, and it shouldn't try to. Migrations are how systems improve. The goal is smaller: when a number goes wrong after one, there should be a clear, boring, repeatable path back to the right answer, instead of a scramble to explain why revenue looked flat for a month.