Data Observability Tools Comparison for SQL Query Tracing
Query tracing reveals why SQL is slow; pipeline tools only catch that it broke.
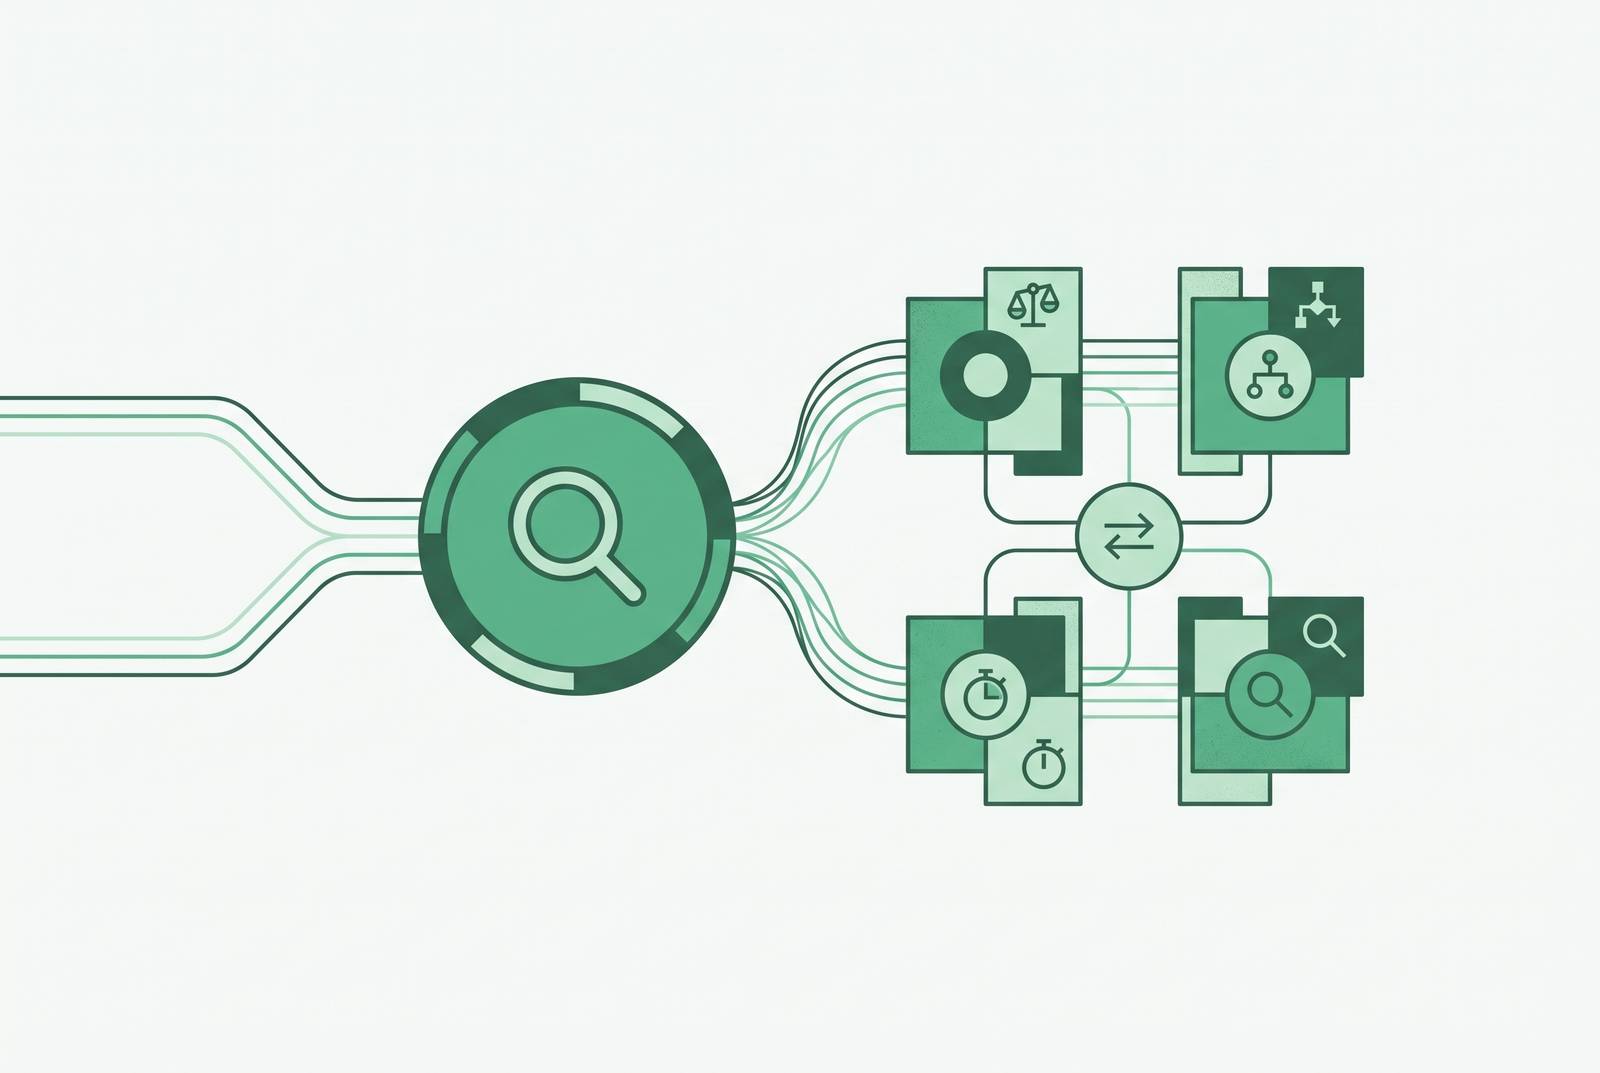
Data observability tools all promise to catch problems before they hurt you. But there are two very different jobs hiding under that one label, and most buyers don't realize it until they've already signed a contract. One job is watching your data pipelines for freshness, volume, and schema drift. The other is watching what happens when a single SQL query hits your database, waits in line, and comes back slow. These are not the same skill. And picking a tool without knowing which one you actually need is how teams end up paying for anomaly detection when what they needed was a query trace.
An application request feels slow. An application request feels slow. A trace shows the database call is the bottleneck. Fine, that's step one. But why is the database call slow? Is it a lock? A missing index? A bad query plan? That last question can't be answered by a pipeline health tool. It needs query samples, explain plans, and wait event data, wired into a trace that connects the app, the SQL statement, and the disk I/O into one causal line. Most tools on the market simply don't reach that deep. This piece walks through who does what, so the mismatch doesn't happen to you.
The five pillars every data observability tool claims to cover, and where SQL tracing fits
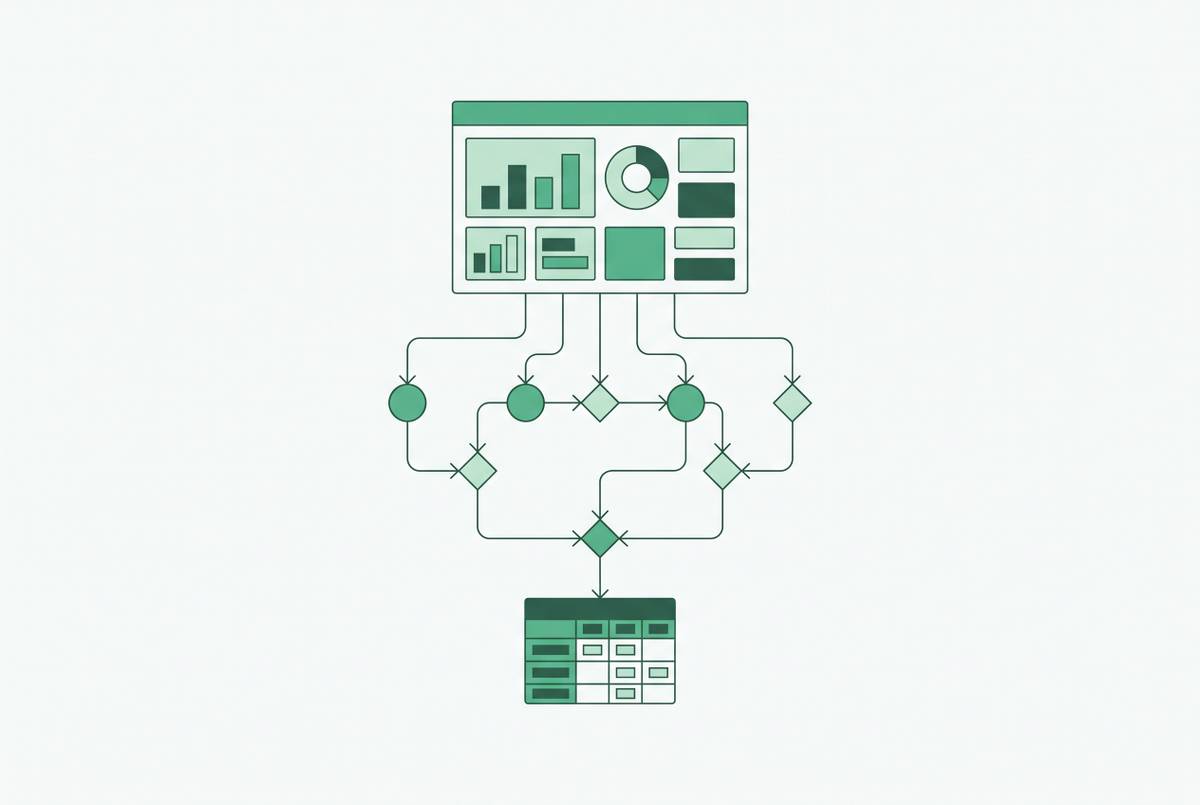
Almost every vendor in this space will tell you they cover five things: freshness, volume, schema, distribution, and lineage. That's the industry's shared checklist, and it's become table stakes. Everyone claims all five. So the real question isn't "does this tool cover lineage," it's "how deep does its lineage actually go?"
Lineage is the pillar that matters most for SQL tracing, and it comes in two flavors. Table-level lineage just tells you table A feeds table B. That's the baseline, and almost every tool has it. Column-level lineage is a different animal: it tells you that this specific column, in this specific report, traces back to that specific field three tables upstream. That's what real debugging needs, and it's also what compliance and audit work needs when someone asks "where did this number come from?"
Does the lineage reach the BI layer? A lot of tools stop at the warehouse and leave the last mile, the dashboard someone actually looks at, as a gap.
None of the five pillars, no matter how well a tool executes them, touch query execution mechanics. None of the five pillars, no matter how well a tool executes them, touch query execution mechanics. Wait events, explain plans, individual query samples, trace links back to application code, that's a separate layer entirely. A tool can ace freshness, volume, schema, distribution, and lineage and still have zero visibility into why a query is slow. Keep that distinction in mind as you read the rest of this, because it's the line that separates the next two sections from the one after them.
Tools built primarily for pipeline and data quality observability: Monte Carlo, Sifflet, Bigeye, Elementary, Anomalo
These tools are good at what they're built for. The point here isn't to knock them, it's to be honest about where their strength ends.
Monte Carlo built its name on machine learning-driven anomaly detection. It scans your metadata, learns what normal looks like, and flags deviations without anyone setting manual thresholds. It covers pipeline visibility, warehouses, and the BI layer, and it does root cause analysis and automated incident routing on top of that. Solid tool, wide coverage. But it has a known soft spot: a known tradeoff with ML-driven detection is alert fatigue, meaning teams can end up spending real time tuning thresholds just to cut down on false alarms. Pricing runs $50,000 to $200,000-plus a year, which puts it out of reach for smaller teams, and it fits best where there's already a sizable engineering org, multiple warehouses, and compliance pressure driving the purchase. For SQL query tracing specifically, that's not what this tool is for. Lineage, yes. Query-execution-level debugging, no.
Anomalo sits in a similar spot: automated anomaly detection, managed platform, light setup. It targets a similar buyer profile: large teams, multiple warehouses, compliance requirements driving the decision.
Bigeye leans hard into automation. It monitors every job, table, and pipeline it can find, and it adapts as new assets show up, so you're not manually adding monitors every time someone spins up a new table. It also opens monitor creation up to analysts and business stakeholders through a no-code interface. Under the hood, it uses time-bound pushdown queries to scan large datasets in Snowflake, Databricks, or BigQuery without dragging down performance, which is a genuinely useful design choice. Where it falls short is lineage depth: it's shallower than what Monte Carlo offers, so if column-level dependency tracing matters to you, plan on pairing Bigeye with something else. And query-execution visibility isn't its strength either.
Tools that add context and routing on top of detection: Atlan, Datafold, Metaplane
A second category of tool doesn't detect anomalies itself. It sits on top of tools that do, and adds the context and routing that turns an alert into an action.
Atlan is the clearest example. It pulls quality signals in from Monte Carlo, Anomalo, Soda, and others into one control plane, so nobody's flipping between five dashboards to figure out what broke. When something does break, it routes the issue to the right owner with context attached: what broke, where it flows downstream, who gets hit by it. Atlan needs a detection tool underneath it. It's not doing the anomaly detection itself, it's organizing what other tools find. Atlan has been named a Leader in the Forrester Wave for Data Governance Solutions (Q3 2025) and in the 2026 Gartner Magic Quadrant for D&A Governance. As a coordination layer, it's useful, but it doesn't trace query performance on its own.
Datafold solves a different problem: what happens downstream when someone changes code. It gives column-level lineage so you can see exactly which datasets and dashboards a code change will touch, one-click regression testing wired into GitHub and GitLab through CI, and custom alerting on top of its diffing and lineage capabilities. It's built for analytics and engineering teams doing data diffing and change validation, not for watching live query performance in production.
Metaplane, now part of Datadog, is a strong Monte Carlo alternative for automated anomaly detection, lineage, and cloud data stack coverage. Being folded into Datadog gives buyers some confidence about long-term platform support and enterprise backing. Practically, this means anyone evaluating Metaplane today is really evaluating the Datadog ecosystem, which connects directly to the full Datadog DBM capabilities covered next.
The throughline across this whole category: these tools close coordination gaps and impact-analysis gaps. They don't trace live query execution. For that, keep reading.
Tools that trace SQL query execution: Grafana Database Observability, Datadog DBM, Google Cloud Query Insights
This layer actually answers "why is this query slow," and only three tools here do it.
Grafana Cloud Database Observability pulls MySQL and PostgreSQL query performance data straight into Grafana Cloud, sitting next to your metrics, logs, and traces, connected through Grafana Alloy. It covers self-managed database servers as well as managed instances on AWS RDS, Amazon Aurora, Azure Database, and Google Cloud SQL. It tracks rate, latency, and error data for queries running against the database. Click into any query and you get:
Query samples: individual executions, with timing and the actual parameters used
The standout feature is trace linkage. A slow span in Explore Traces or Traces Drilldown links directly to the Database Observability view for that query, showing its samples, latency, and history. It works the other direction too: from a query back to the trace that triggered it. That closes the loop mentioned earlier, a slow app request traced all the way down to the exact query and why it dragged. Grafana also surfaces AI-assisted suggestions that use the query's performance context to recommend potential fixes. Grafana Labs was named a Leader in the 2026 Gartner Magic Quadrant for Observability Platforms.
Datadog Database Monitoring (DBM) connects database performance and service performance in a single view, so you're not jumping between two products to see both sides of a slow request. It surfaces cross-stack optimization tips by connecting database performance with application-level context in one place. It comes with out-of-the-box monitors and SLO tracking for database reliability, plus dashboards that put database trends next to metrics, traces, and logs. The bigger organizational win is that shared visibility breaks down the usual wall between developers, ops, and database teams, all looking at the same data instead of arguing over whose graph is right. DBM traces issues across the full data lifecycle, from the application and pipeline layer, through the warehouse, up to the BI dashboard, and it connects traces, logs, and job context to help teams move from alert to resolution more quickly. Datadog has been named a Leader in the Gartner Magic Quadrant for Observability Platforms for six years running, and the company holds a reported 51.82% share of the data center management market, serving more than 47,431 customers. One real caveat: Datadog bills per host, plus separate per-GB log charges and per-custom-metric charges that stack up fast, so budgeting DBM as an add-on to an existing Datadog contract can get unpredictable at scale.
Google Cloud SQL Query Insights, paired with what Google now calls Observability Analytics (the rebrand of Log Analytics, with trace data inside it reaching general availability in June 2026), brings logs and traces into one experience, letting you move from a high-level trend down to root cause without switching tools. Query Insights uses sqlcommenter to automatically instrument ORMs. It can point straight at the application code responsible for a database problem, not just the query itself. It supports OpenTelemetry standards, and query metrics and traces are available through the Google Cloud Observability API, which plugs into Cloud Monitoring for custom dashboards and alerts sent over email, SMS, Slack, or PagerDuty. It's a natural fit for teams already living in GCP. Multi-cloud teams or those heavily invested in another major cloud provider will find more friction here than the other two options.
Put side by side: Grafana's trace linkage is the most distinct SQL tracing feature of the three. Datadog's edge is correlating application and database performance across one platform. Google's Query Insights is the lowest-friction pick if you're already GCP-native and want your ORMs instrumented without extra setup work.
OpenTelemetry as the instrumentation layer underneath SQL tracing
None of the trace linkage described above happens by magic. Something has to generate consistent, structured trace data that both the application layer and the database layer agree on, and as of 2026, that something is OpenTelemetry. It's the only standard that unifies database metrics and application traces under one shared data model, which is exactly the plumbing that trace linkage depends on.
It is the second-largest project in a leading cloud-native open source consortium, behind only Kubernetes, and roughly half of organizations are already using it or actively planning to. For SQL tracing specifically, it's the mechanism that lets an application span connect to a specific database query execution, across vendor lines, so you're not locked into one company's proprietary agent to get that connection.
That last part matters more than it sounds. Building your instrumentation on a vendor's proprietary agent means you're stuck redoing that work the next time you switch platforms. Building it on OpenTelemetry lets you swap the backend, Grafana, Datadog, whatever comes next, without touching the instrumentation code again.
Native warehouse monitoring as a low-cost alternative to standalone tools
Not every team needs a dedicated tool at all. Major warehouses ship with their own native monitoring capabilities, often enough to spot a slow query or a runaway job without paying for a third-party platform on top. For a smaller team, or one just starting to care about performance, that native tooling is a reasonable place to begin.
The tradeoff is depth. Native monitoring generally won't reach the depth that dedicated tools offer across trace linkage, query diagnostics, and lineage spanning a multi-tool data stack. It answers "what happened in the warehouse" well. It doesn't usually answer "why did the application feel this," which is the exact gap that Grafana Database Observability, Datadog DBM, and Google Query Insights are built to close.
The choice between them is about scale and cost. It's about scale and cost. A team running one warehouse with a small number of people watching it can often get by on native tools and defer the extra spend. A team spanning multiple services, multiple databases, and a compliance requirement or two will hit the ceiling of native monitoring fast, and that's when the standalone tracing tools start earning their price tag.