Column-Level Lineage in dbt for Metric Auditability
Track which exact source columns feed your metrics, not just which tables.
Column-level lineage answers a question that table-level dbt lineage can't: which exact source columns feed a specific number on a dashboard. That distinction sounds small. It isn't. A metric like "net revenue" might pull from three columns spread across two models, and if a dashboard shows the wrong number, table-level lineage can tell an analyst that fct_revenue depends on stg_orders. It can't tell them which column changed, why, or who touched it last.
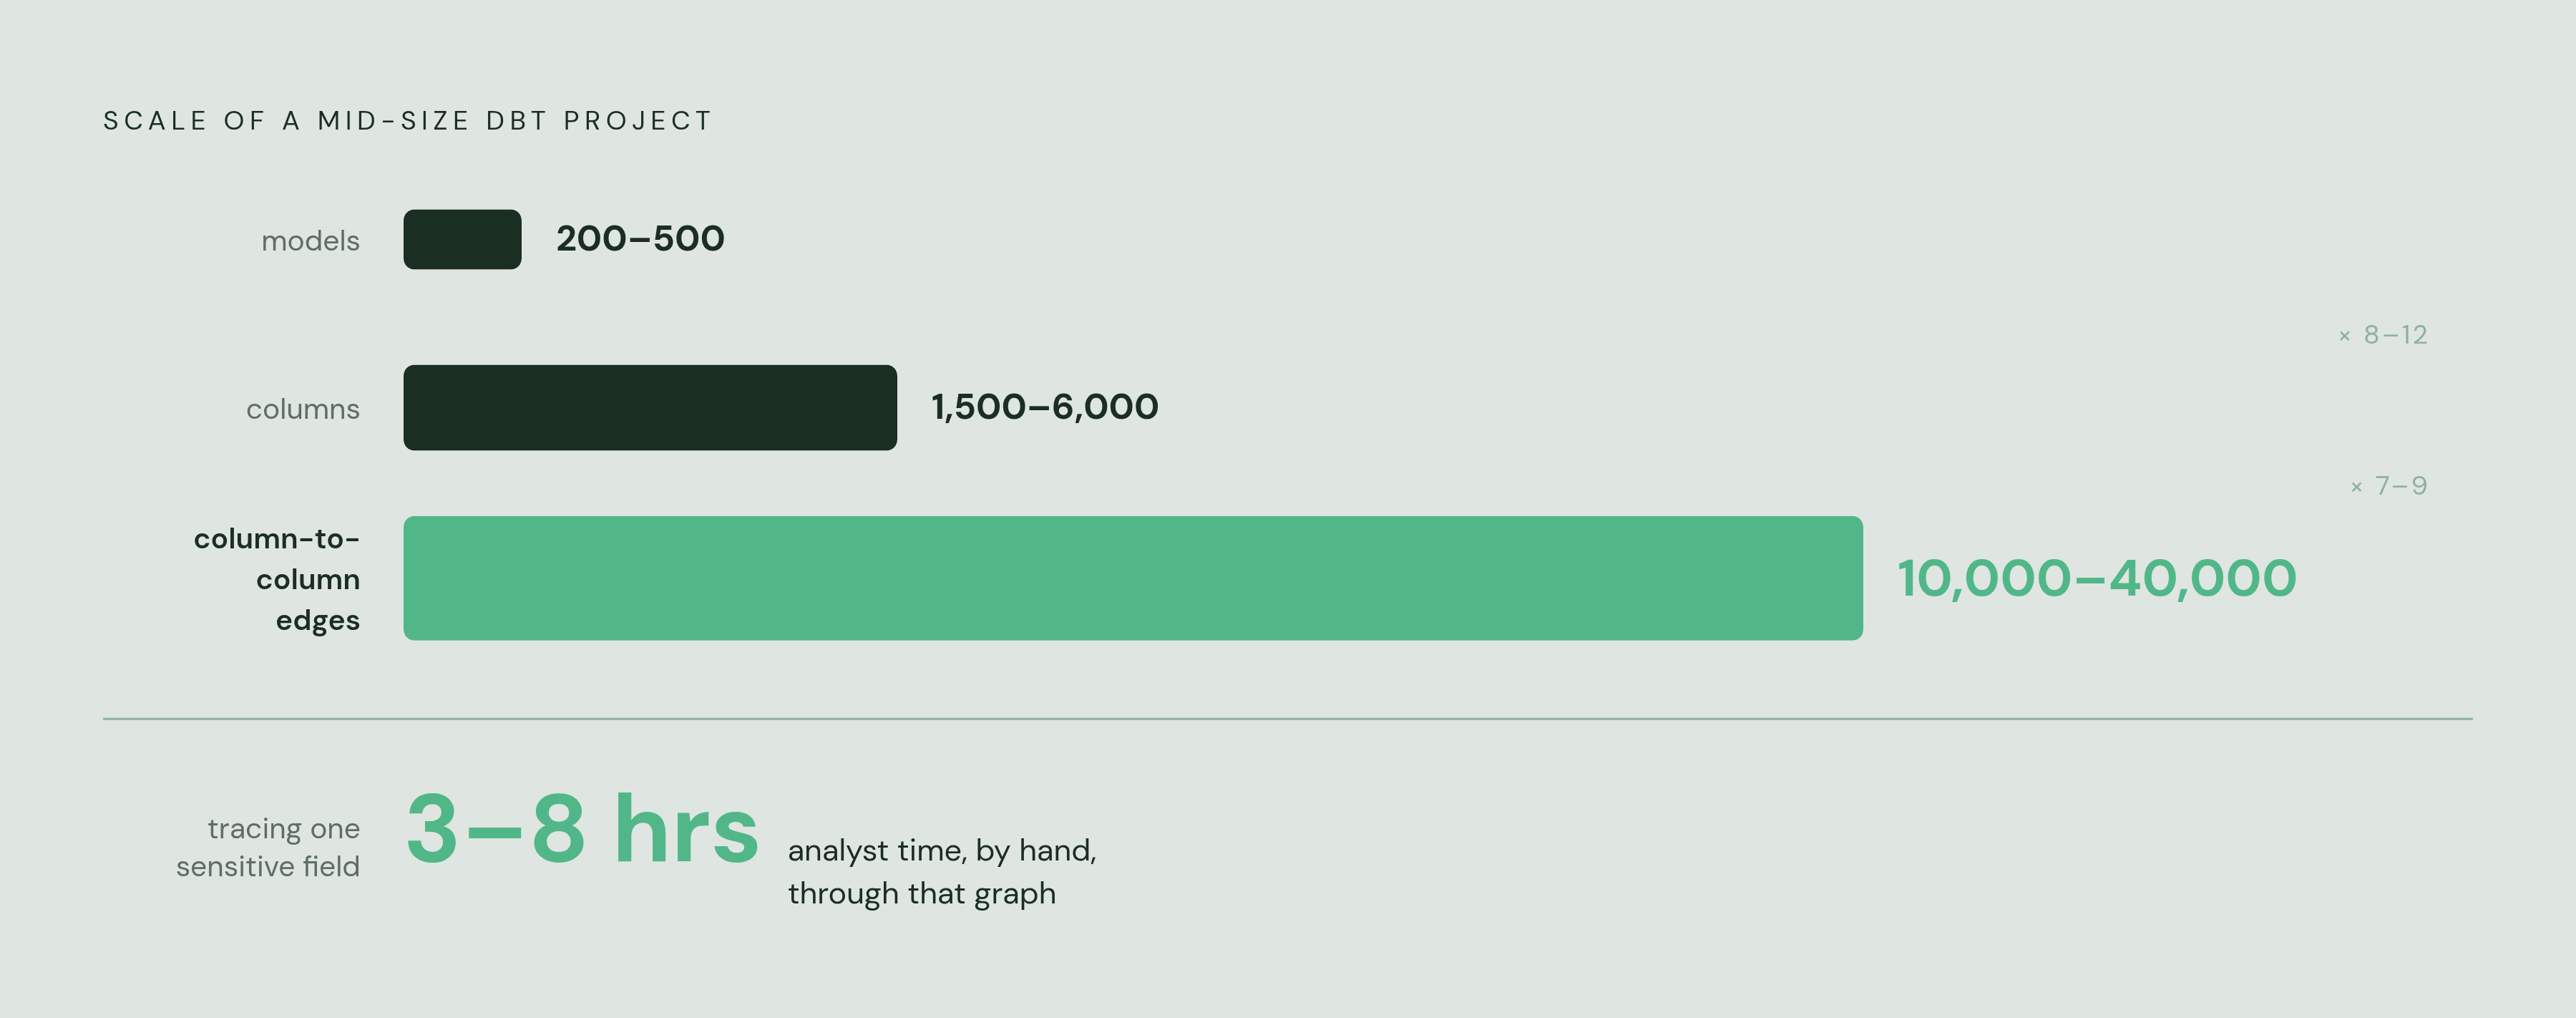
At small scale, this gap doesn't matter much. A team with twenty models can trace a broken number by eye. But dbt projects grow, and once a project passes a few hundred models, tracing anything by hand turns into a research project. Research published by Malviya and colleagues in the Journal of Electrical Systems (2025) puts a mid-size enterprise dbt project at 200 to 500 models, generating 1,500 to 6,000 columns and somewhere between 10,000 and 40,000 column-to-column edges. Tracing one sensitive field by hand through that kind of graph costs 3 to 8 analyst hours, according to the same research. Ask for that trace every time an auditor or a stakeholder gets nervous, and the cost adds up fast.
Table-level lineage has three specific blind spots:
- It can't say which downstream columns or dashboards actually break when a column gets renamed or dropped.
- It can't prove to an auditor that a PII, PCI, or PHI field was masked before it reached a report.
- It can't flag that one column in a metric's source changed without flagging the whole upstream model as changed, which buries the real signal in noise.
Column-level lineage (CLL) is built to close each of those gaps. But it comes with its own limits, and understanding those limits matters just as much as understanding what it fixes.
How column-level lineage works: SQL parsing, column-to-column edges, and what dbt computes
CLL tracks individual columns as they move through a pipeline: passed through unchanged, renamed, or transformed by an aggregation, expression, or function. The mechanism behind this is static SQL parsing. dbt reads the compiled SELECT statements in a project and pulls out column-to-column edges, one field at a time. dbt Cloud does this natively inside Explorer, with no extra packages needed. The output is a directed graph of column relationships that sits on top of the regular model DAG.
One useful feature that comes out of this is the column evolution lens. It separates columns that were simply passed through or renamed from columns that were actually transformed. Passthrough and rename columns inherit their descriptions automatically from wherever they came from, so nobody has to rewrite documentation for a field that hasn't changed in years. Transformed columns get flagged instead, and that's the signal worth paying attention to: something about the shape of that value actually changed.
Central to this is manifest.json, the file dbt generates that holds the full DAG, compiled SQL, column definitions, tests, descriptions, and tags. It's the artifact that most outside tools read when they want to reconstruct lineage without re-parsing everything from scratch.
Parsing isn't foolproof, though. dbt's own docs list several known failure modes:
- A parsing error, when SQL is too complex or ambiguous (a gnarly lateral join, for instance).
- A Python model error, since Python models can't be parsed for lineage at all.
- An "unknown" error, usually caused by hardcoded table names in place of
ref()statements, which breaks the graph's ability to connect models. - JSON unpacking issues, where the origin of a column just comes back as unknown.
CLL only reflects what shows up in SELECT statements, which is a scope limit worth remembering. Joins and filters don't appear in the column-level graph. So the lineage answers "where did this value come from," but not "what conditions were applied to get it there."
What dbt Cloud provides natively and where the open-source version stops
CLL inside dbt Cloud's Explorer, under the Catalog tab, is available on Enterprise plans, with no setup required beyond normal project configuration. It became generally available in 2024, alongside model performance analysis and project recommendations. As of 2025 and heading into 2026, supported warehouses include Snowflake, BigQuery, Databricks, and Redshift. Lineage refreshes after any job run that executes dbt docs generate in production or staging, so the graph reflects whatever was most recently deployed, not necessarily what's sitting in a developer's branch.
dbt Core, the open-source version, doesn't support CLL natively in its stable v1.x line. dbt Core v2.0 has been announced for June 2026 and built on the Fusion engine, but native CLL remains tied to proprietary tooling and is not part of the open-source Core binary available today. For teams on Core right now, there are a few paths: SQLMesh, SQLLineage, or the Power User for dbt extension for VSCode. Power User for dbt shows column lineage inside the model DAG, right in the editor, and displays the transformation type for each column. It's free with an Altimate API key, though the column lineage view currently sits behind a beta flag.
Even inside Explorer, there's a practical ceiling. Reported benchmarking notes usability dropping off once a project passes roughly 100 models, which matters a lot for any team whose project has outgrown that size already, since 100 models is a small fraction of what a mid-size enterprise project actually looks like.
The bigger architectural point, though, applies to both dbt Cloud and dbt Core: CLL only covers what lives inside the dbt project. A table built by Airflow, a model scored by a separate machine learning pipeline, a dashboard built on top of dbt output, none of that appears in native CLL. dbt knows its own DAG. It doesn't know what happens after data leaves it.
How the dbt Semantic Layer and MetricFlow connect metric definitions to column lineage
Most metric inconsistency problems start upstream of lineage. Metrics like "revenue" or "active users" often get defined inside a BI tool, which means the definition is tool-specific, not version-controlled, and invisible to anyone who isn't looking at that particular dashboard. Two teams can build "revenue" two different ways and never know it until the numbers don't match in a meeting.
The dbt Semantic Layer is built to close that gap. Metrics get defined once, in YAML, as semantic models, metrics, and dimensions. Every downstream tool then queries that one shared definition, so "revenue" means the same thing whether it's pulled into a spreadsheet or a dashboard.
MetricFlow, the engine behind the Semantic Layer, adds a few properties that matter directly for auditability:
- Every metric traces back to a YAML definition that's version-controlled and can be inspected line by line.
- Every query is explainable: the joins, filters, time grains, and access policies involved are visible at query time, not hidden inside a BI tool's internal logic.
- dbt Labs has laid out a roadmap that includes role-based access, versioned changes with review, and stronger auditability features going forward.
At Coalesce 2025, dbt Labs relicensed MetricFlow from BSL to Apache 2.0, aligning it with the Open Semantic Interchange effort (OSI, now called Apache Ossie), built in public alongside partners including Snowflake and Salesforce. The goal is metric definitions that work the same way no matter which cloud or tool is asking for them. As of 2025, MetricFlow supports several warehouse platforms, with BI integrations through the dbt Cloud Semantic Layer reaching tools including Hex, Mode, Power BI, Google Sheets, and Excel.
Here's where MetricFlow and CLL connect: MetricFlow ties a metric definition to specific columns in a semantic model. CLL then traces those exact columns back through every transformation that touched them. Put together, that's a full chain from the number on a dashboard back to the raw field it came from. Without both pieces working together, a metric can be well-defined but its ancestry still untraceable, which describes where a lot of teams currently sit.
Extending lineage past the dbt project boundary: exposures and the last-mile problem
dbt knows what it built. It has no idea how the business actually uses it. A dashboard sitting on top of fct_revenue is invisible to dbt's DAG unless somebody tells dbt it exists. That's the last-mile problem, and it's a real gap, not a theoretical one.
Exposures are dbt's answer. An exposure is a metadata object that declares a downstream consumer, a dashboard or an application, as a node in the lineage graph. Manual exposures work fine and give full control, but they require someone to keep the YAML updated every time a dashboard changes, gets rebuilt, or gets retired. Manual exposures require someone to keep the YAML updated every time a dashboard changes, gets rebuilt, or gets retired, and exposures that go stale don't just sit there harmlessly, they actively misrepresent the dependency graph to anyone who trusts them.
dbt shipped automatic exposures for Tableau in 2024, which removes the manual YAML step for that integration; a similar Power BI integration has been described as coming, though not yet shipped. Rahavan Raman, Director of Data Engineering and Analytics at Zscaler, described the shift this way: "With auto-exposures in dbt Explorer, it's like going from a treasure hunt to having a treasure map. The native Tableau integration and auto-generated lineage help us see everything clearly, making impact analysis across hundreds of dashboards a breeze."
Other approaches take a different route. Datafold, for instance, parses SQL logs directly from the warehouse and combines that with BI tool metadata to build a dependency graph covering dbt models, non-dbt assets like reverse ETL syncs or ML models, and BI dashboards all at once. It's a broader net, built on a different integration model than exposures.
Why does any of this matter for auditability? Because if a metric's downstream consumers aren't in the lineage graph, impact analysis is incomplete by definition. A column changes upstream, nobody flags it, and a dashboard nobody knew existed quietly starts showing the wrong number.
Why compliance requirements specifically demand column-level, not table-level, evidence
Table-level lineage tells an auditor that the customers table came from raw_crm. That's a general assertion. Column-level lineage proves that email came specifically from raw_crm.contact_email, was lowercased in stg_customers, and was masked before it reached any downstream report. That's a verifiable trail, and it's the difference auditors actually care about.
Regulatory pressure is moving specifically toward this kind of column-level evidence for PII, PCI, PHI, and financial fields. Organizations running only table-based DAGs are increasingly unable to answer detailed compliance requests, according to the ResearchGate (2025) research.
A CLL-based compliance workflow produces a few concrete things:
- Proof that a sensitive field has a named owner, a clear definition, and a documented chain of transformations.
- For SOC 2 or ISO 27001, a metric's full lineage that's inspectable and version-controlled end to end.
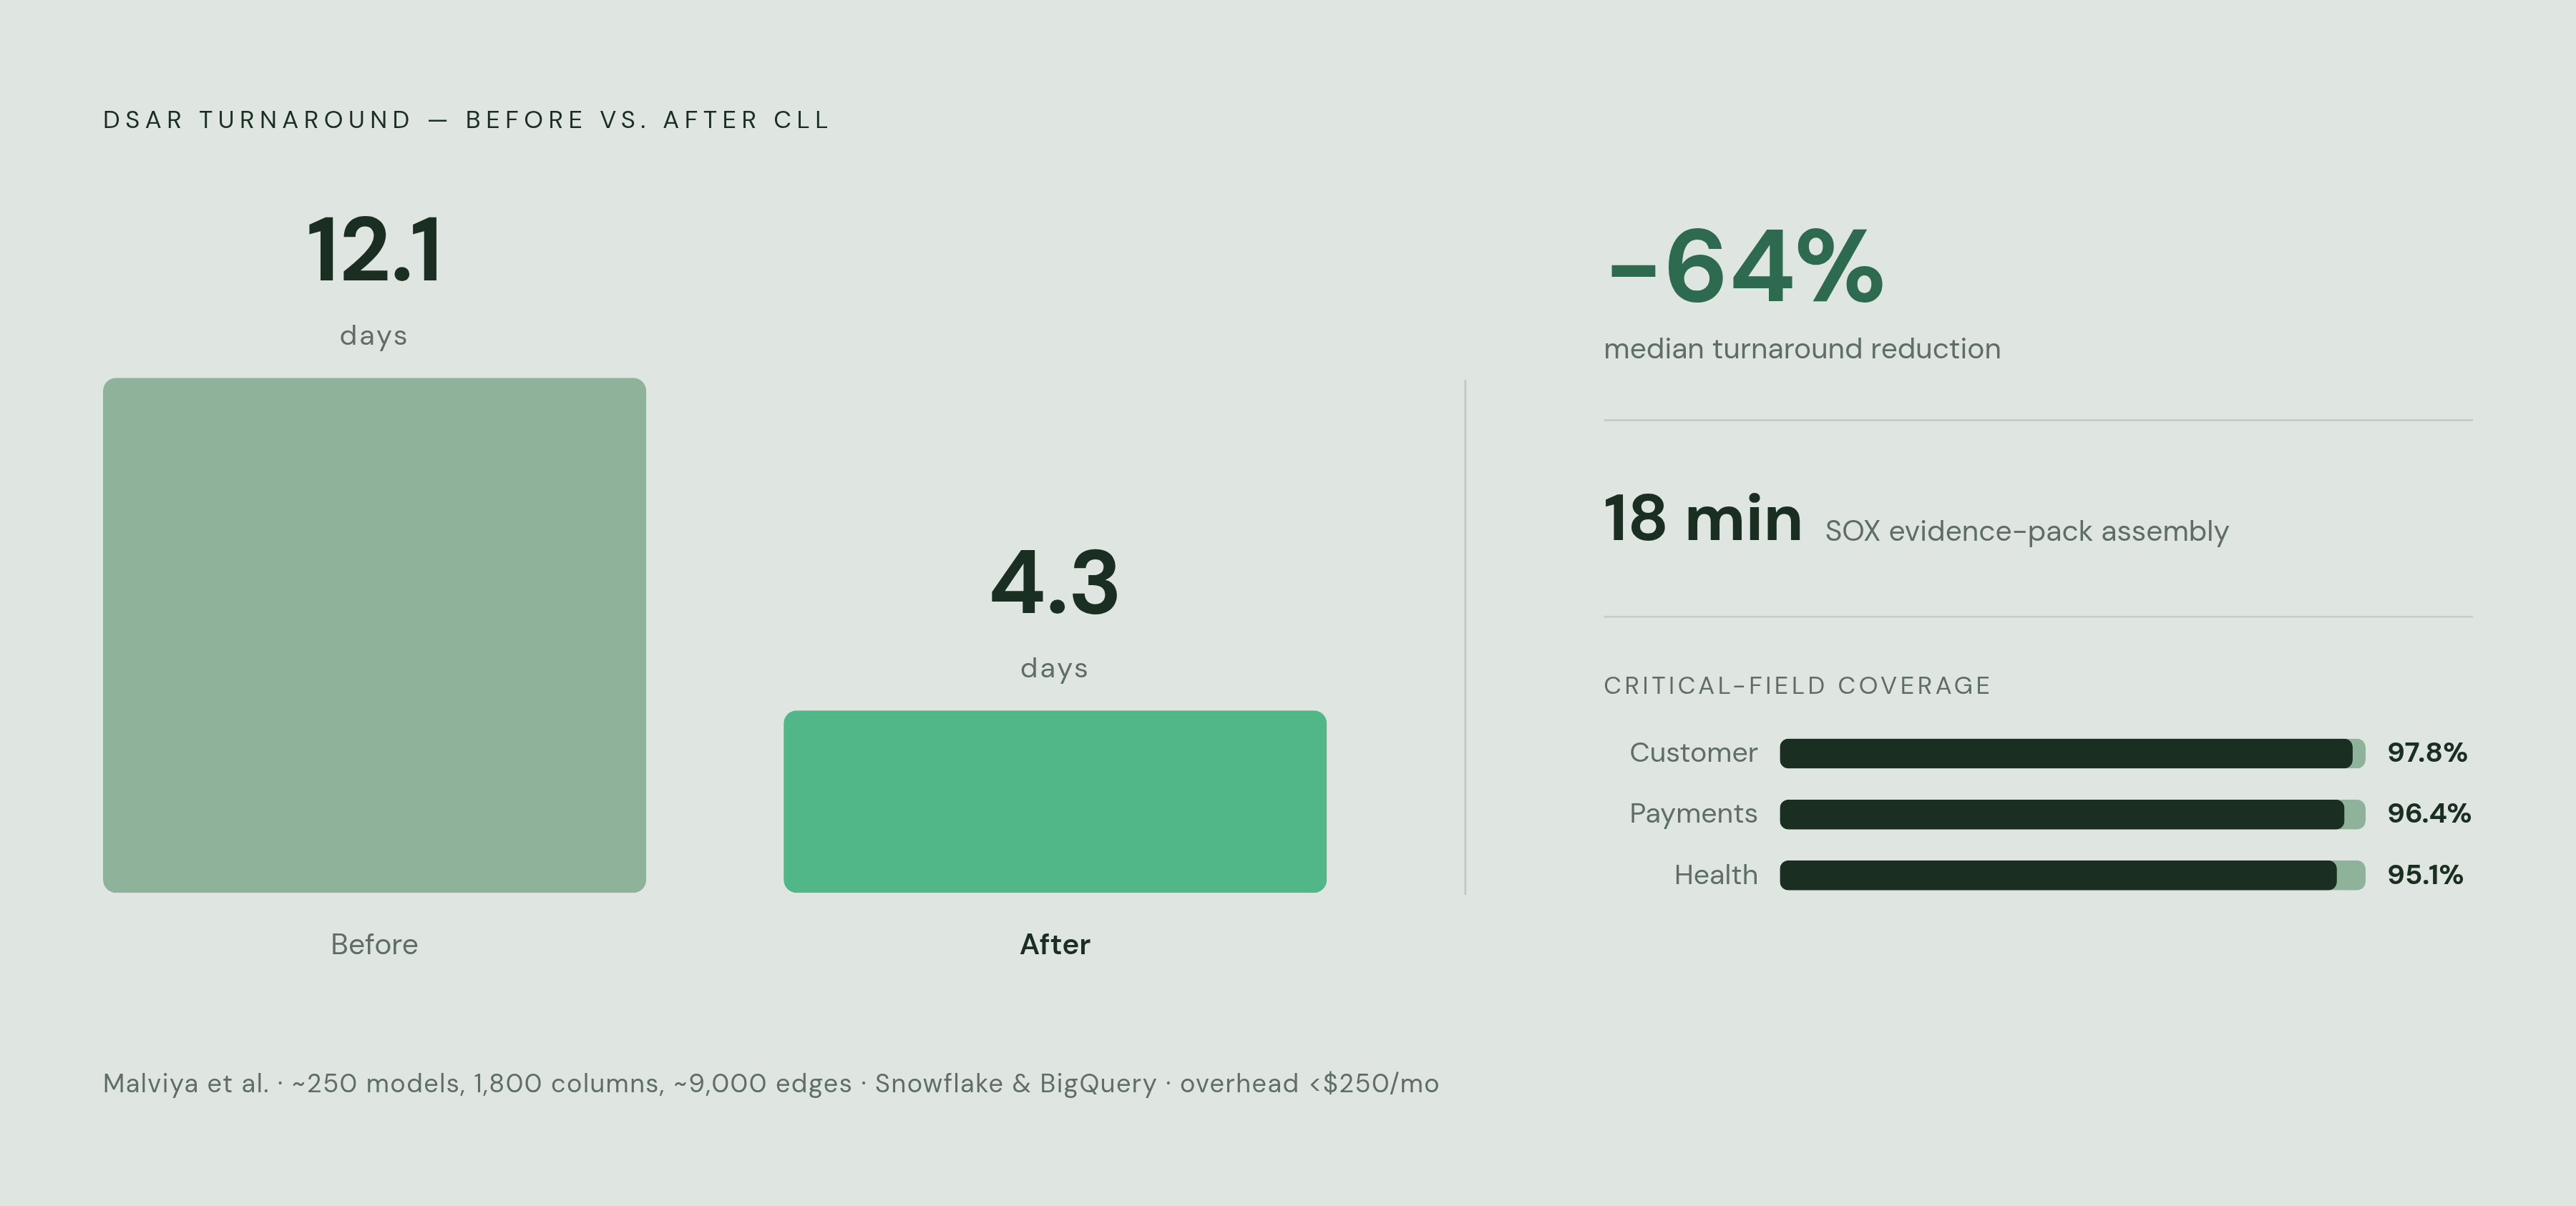
- For SOX evidence packs, the same study (run on roughly 250 models, 1,800 columns, and about 9,000 edges, tested on Snowflake and BigQuery) found evidence-pack assembly time dropped to 18 minutes.
- For DSAR (data subject access request) turnaround, median time dropped from 12.1 days to 4.3 days, a 64% reduction, in that same study.
- Quarterly defect leakage held steady at 1.6% in the tested environment.
Coverage numbers from that research: 96.7% overall critical-field coverage (broken down as 97.8% for customer fields, 96.4% for payments, 95.1% for health data), with precision at 0.971 and recall at 0.934. That number is the accuracy delivered by a system tested in a production-similar environment, not a claim about what dbt's native tooling delivers on its own.
The operational cost of adding this kind of compile-time CLL tracking was bounded in the study: a 7.6% compile and run overhead, lineage metadata under 5 GB a month, and a platform cost increase under $250 a month at that scale. None of that is free, but none of it is prohibitive either.
The takeaway: CLL isn't just a nice-to-have for developer productivity. It's the actual artifact that makes a metric defensible when someone outside the company asks to see the receipts.
Where native dbt CLL falls short and what teams typically add to close the gap
Native dbt tooling has three real limits:
- No audit trail, no role-based access control, and no one-click evidence export for auditors built into dbt docs.
- A usability ceiling around 100 models inside Explorer, per reported benchmarking.
- No coverage past the dbt project boundary. Non-dbt pipelines and BI consumers need manual exposures or outside tooling to show up at all.
- Parsing failures (Python models, complex lateral joins, JSON unpacking, hardcoded table names) leave silent holes in the graph, with no default alert telling anyone a gap exists.
- No automatic blast-radius calculation when a column changes.
- No alerting or collaboration layer. Teams typically find out something broke after it's already in a report, not before.
To close these gaps, teams tend to layer on a few specific patterns:
- Compile-time CLL extraction, pulling from
manifest.jsonplus compiled SQL, stored in a separate governance system and mapped directly to compliance controls. This is the approach validated in the Malviya et al. study. - Specific engineering choices that measurably improved coverage in that study: materializing transient models added a modest boost to recall; macro-depth limits combined with explicit select lists added a comparable boost; best-effort tracking of user-defined functions added a smaller additional gain.
- External data catalogs or governance platforms that ingest
manifest.jsonand add access controls, alerting, and cross-tool lineage on top. - SQL log-based lineage tools, like Datafold, that parse warehouse query logs directly to pick up non-dbt assets.
- The dbt Semantic Layer as the anchor point for metric definitions, which shrinks the surface area of "what needs auditing" by centralizing every definition in one version-controlled place.
Full column-level metric auditability, in practice, looks like four pieces working together: dbt's native CLL for tracing columns inside the project, MetricFlow for governing metric definitions, exposures (automatic or manual) for downstream consumer coverage, and a governance store or catalog for actually assembling audit evidence when someone asks for it.
Open problems remain, and the Malviya et al. research is upfront about them: dynamic SQL, non-dbt pipelines, sub-minute streaming lineage, and detecting when two differently-written columns are semantically the same thing. These are still areas the field is actively working through, not solved problems.
For teams querying dbt models directly through a database GUI or an internal tool, where SQL gets written ad hoc against a mart table, the same logic applies. Knowing exactly which source columns feed a mart column is the foundation for trusting any number that comes out of it, whether that number is in a polished dashboard or a quick ad hoc query somebody ran an hour before a meeting.
Sources
- (PDF) A DBT-Based Column Lineage Tracking Approach for Regulatory and Audit Compliance
- Column-level lineage | dbt Developer Hub
- Column-Level Lineage, Model Performance, and Recommendations: ship trusted data products with dbt Explorer | dbt Developer Blog
- docs.getdbt.com
- docs.getdbt.com
- docs.getdbt.com
- docs.myaltimate.com